Understanding and interpreting data on your website
In a world where it’s very easy to see how many likes you’ve got on a recent post or the number of followers you’ve achieved in the last month, it can be easy to forget the most important stat of them all, who and how many people are viewing your website.
Website views, average session time, and where those visitors come from can let you know if things are working, or if things need to be tweaked. If you’re getting 10 views to your website a month, the chances are you’re not going to see the kind of consistent enquiries you might crave.
In this article, we’ll first tell you how to set up analytics on your website, and then how to view and digest that data every month with a few easy actionable steps to grow and improve on those numbers.
What is Google Analytics?
It’s a completely free tool made by Google, that helps you track views of individual pages on your website. You can use this to see how long people are on a particular page, a small amount of data on location, where they found your website and if they are a ‘returning user’. With this information you can see which pages are performing (or not performing) and adjust your website to better target your audiences.
Installing the tracking code
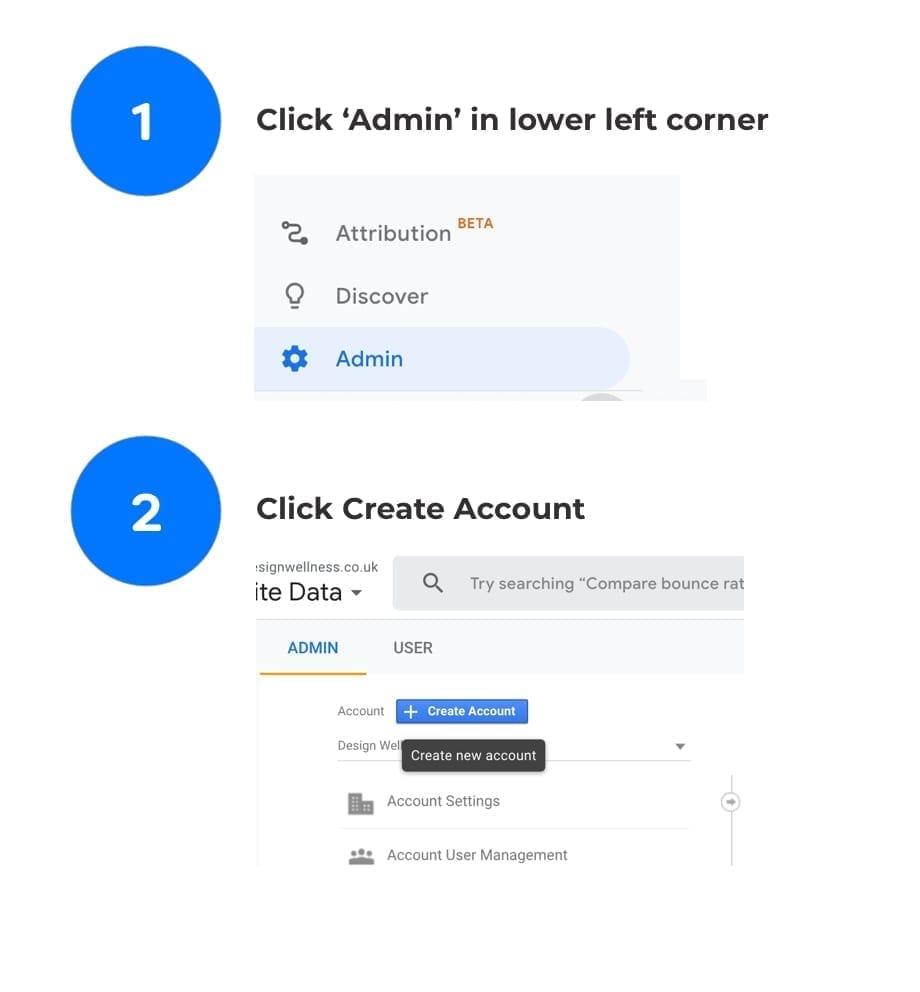
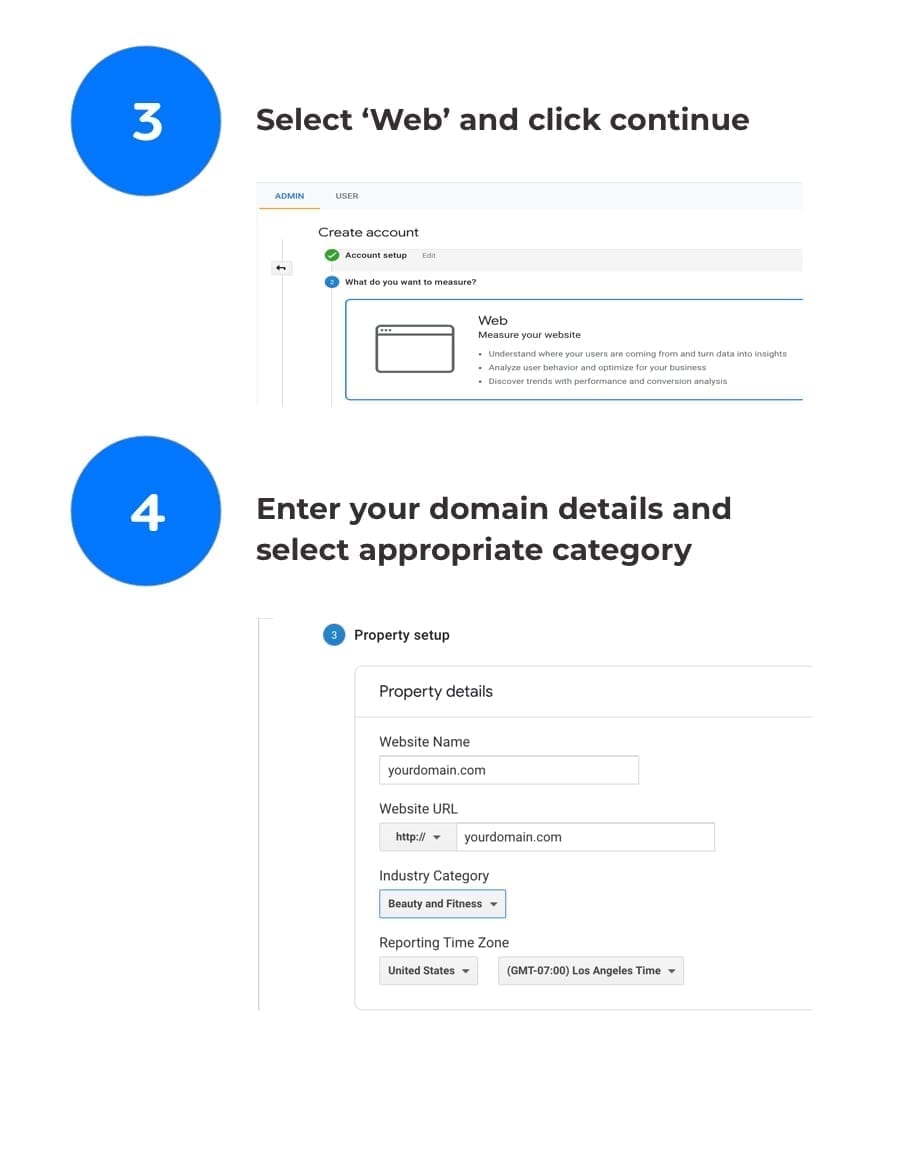
If you have access to your website, or know someone that does – you need to install a ‘tracking script’. This needs to be put at the top of your website and is completely hidden from the front of your site but tracks every visitor that comes onto your site. To get this script you’ll need a Google account (if you don’t have one they are really easy to set up).
If you have a Google Account – navigate to http://analytics.google.com/ and sign in with your google account.
Guides for installing tracking script in website
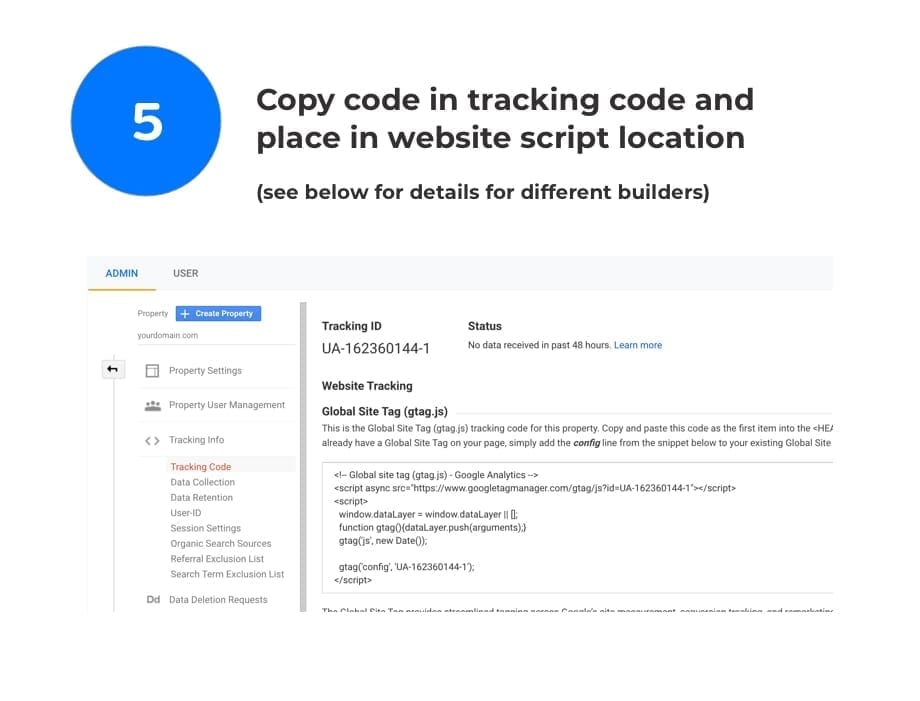
If you’re using a website builder, here are a few guides for various site buiders so you can easily add the above code into them. Alternatively if you’re using a more custom setup, you can send it to your web developer to add. As soon as the tracking code is operational, it normally takes around 24 hours to start to collate information, so make sure to return the next day to see the new stats!
If you’re still struggling, send us a message and we’ll gladly help you out to get this set up, completely free of charge!
Now you’re up and running!
So hopefully you’ve got your tracking code to work, this is the fun bit! You’ll now be presented with a lot of information, too much information. So here is a quick overall ‘terms’ guide to the words you’ll see and what they mean.
Views – A view of an individual page
Sessions – An end user that navigates your website within a specific timeframe, for example a session would be browsing your website for a continued period of time. If the user then navigates away and returns later in the day, this would be a different session.
Users – A visitor that has visited your site, if they return they are still classed as the same user
Bounce Rate – The percentage of visitors that visit a given page and do not navigate to another page, the higher the bounce rate the more chance users aren’t navigating your site properly.
Organic Search – Your website has been visited by someone using a search browser, such as Google or Bing
Direct – A visitor has visited your site via the direct link, or typed your site into the address bar
Social – A visitor that has come from a social media channel such as Instagram, Facebook, Twitter
Goals – An advanced part of analytics, where you can set up goals to track specific actions on your website
Drop-offs – A user leaving your website on a specific page, commonly seen in the ‘Behaviour’ menu
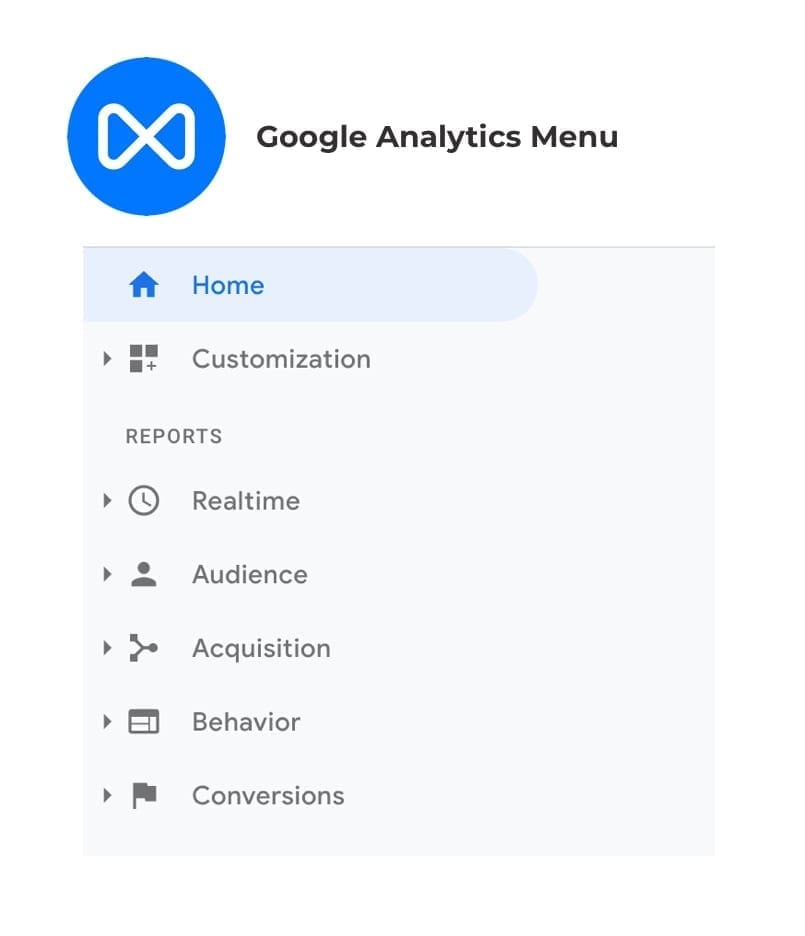
Here are the main resources you can access and easily interpret the data, there is a lot more but these are the key components.
Audience
The audience menu item showcases all information about the end user, this can be as high level or as detailed as you like however in most cases you won’t be able to track interests, age, or gender via this as this is commonly used by mobile applications (downloaded via ios / android). You can however utilise browsers, wether or not the visitor is using a tablet, mobile or desktop.
Acquisition
Specific data from where that visitor has come from is located here. You can see detailed reports on which social channel is working better for you.
Behaviour
Find out about how a user has navigated your site, which pages they have visited and ultimately where they then left.
Useful numbers to look out for, and how to use these to improve
Users and Session duration
By monitoring these two stats across a set timeline you will see an accurate reflection of how many individual visitors are coming to your site. Pageviews and Sessions might not be a true reflection as these numbers can be multiplied if a user refreshes or comes back later in the day. The more users you get the more chances enquiries will come in, alongside a healthy session duration (2 to 3 minutes) will indicate if a visitor is ‘engaged and interacting’ with your content. If you have a low duration (less than a minute) you might need to adapt your page to be more readable or your content more engaging.
Increasing back links to your website on social media
When reviewing your traffic source, if you have a high number of visitors based off socials, this can normally indicate those users are of a higher ‘quality’ of visitor than those found through organic search. By quality, we mean the more chance of them being invested in you or the services you offer as they will of reviewed your Facebook, Instagram or Twitter and want to know more. By organic searching your name is set against many others, with only a little of information to be gleamed from your name and page title. We suggest creating blog posts on your website, or consistently linking to your website from your social media channels. This increases your search ranking in Google, whilst also driving people to really know more about the services you offer.
Try to decrease your bounce rate
The lower your bounce rate, the more people come to your page and stay. A higher bounce rate literally means visitors are hitting your page and ‘bouncing’ off. A few crucial things will increase this; decrease your sites load time. If it takes a few seconds for your page to load, people are more likely to get fed up and not wait around. Particularly in the younger generations, were so used to instant information that if you have to wait, you’ll no doubt frustrate your end user. Format your content and make it easier to understand – a load of text in big blocks that is both unreadable and uninteresting will put off a user. Split your content up into manageable sizes with descriptive headings to really entice the user to reading more.
With more data, comes more responsibility
The good thing is about leaving this to track, as the months go on and you alter your strategy or increase the amount of audience interaction, the numbers will increase. It can be quite addictive to see how subtle changes can have a positive effect on website viewers. If you want to know more about how to benefit from analytics please give us a shout, our plans include SEO reports that help detail easy steps to take to get those little boosts you’re looking for. We’ll be releasing an article soon on utilising keywords in your blog posts and tracking them online so stay tuned!
Thanks for reading,
Graham